SpaceX Options: Was the SPCX Long Straddle a Winner?
I drafted the first version of this post on Friday, June 12, the day SpaceX began trading. The idea was simple: explain why options could list unusually quickly after the IPO, then evaluate a long straddle as soon as the chain opened.
Work got busy and I did not publish it. That delay gave us a much better story.
The volatility thesis was right. SPCX traded through a $78.53 high-to-low range in the first seven sessions after its IPO. But the options market was not asleep. Opening premiums were enormous, implied volatility was already pricing chaos, and the outcome depended heavily on expiration and exit timing.
That is a more useful result than simply saying, "I knew SpaceX would move."
Here is the verdict as of Saturday, June 27:
- SpaceX priced its IPO at $135 per share.
- The stock began trading on Friday, June 12 on Nasdaq and Nasdaq Texas under SPCX, as described in the official Nasdaq listing notice.
- Options began trading on Tuesday, June 16, the second business day after the IPO.
- SPCX reached $225.64 that morning, then traded down to $147.11 on June 23.
- A long straddle could be profitable if the move was monetized quickly, but the opening IV was far too high to call the trade an automatic winner.
Why SpaceX Options Could List So Quickly
Before the IPO, a colleague asked an AI when options normally begin trading after a new listing. The answer started with the familiar "three to five business days" explanation. Once SpaceX was mentioned, it became much more specific and claimed that June 16 was unconditionally confirmed.
The date was plausible. The certainty was not.
There is no universal rule that every IPO must wait exactly three business days. Exchanges can accelerate option listings for qualifying IPOs with a market capitalization of at least $3 billion. Under the SEC-approved accelerated process, eligible options can begin trading on or after the second business day following the IPO day.
SpaceX started trading on Friday, June 12. Monday was the first business day after the IPO and Tuesday was the second. The options did, in fact, start trading that Tuesday.
The lesson is not that the AI was secretly right. It is that a plausible date, a conditional plan, and a final listing are three different things.
Why I Expected SPCX to Be Violent
I do not think every popular IPO should automatically be called a meme stock. Airbnb was not Beyond Meat. Reddit was not Robinhood. They did share something useful for this discussion, though: all four were high-attention IPOs with uncertain price discovery, heavy retail interest, and very little public trading history.
Their first 20 sessions were not exactly quiet:
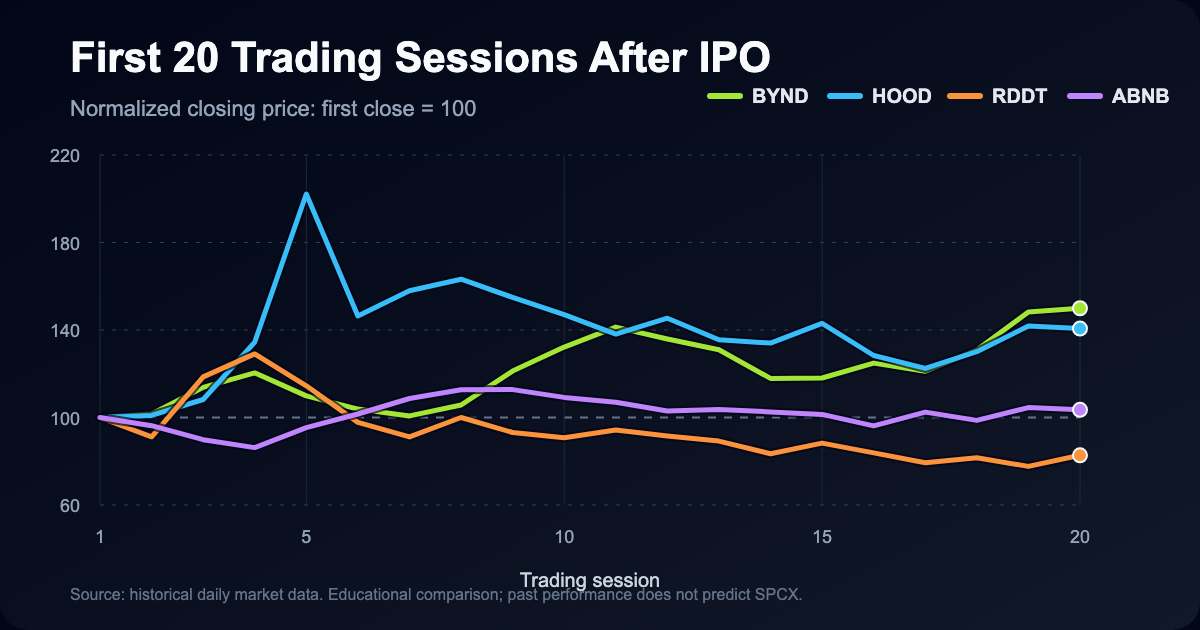
| IPO | First close vs. IPO price | Low-to-high range during first 20 sessions | 20th close vs. first close |
|---|---|---|---|
| Beyond Meat (BYND) | +163.0% | ~133.9% | +49.9% |
| Robinhood (HOOD) | -8.4% | ~155.6% | +40.7% |
| Reddit (RDDT) | +48.4% | ~100.5% | -17.3% |
| Airbnb (ABNB) | +112.8% | ~44.0% | +3.5% |
The chart normalizes each stock's first closing price to 100. The range column uses the lowest intraday low and highest intraday high observed during those first 20 sessions. I calculated the figures from public daily OHLC history and the companies' disclosed IPO prices. These are historical comparisons, not forecasts for SPCX.
The setup was there: a famous company, an unusually large IPO, limited public price history, massive attention, and no established options market. Expecting a wide distribution of outcomes was reasonable.
What SPCX Actually Did
The first two weeks delivered both the upside acceleration and the violent reversal:
The stock prices below use consolidated SIP bars. The option analysis later in the post uses consolidated OPRA trade bars, both accessed through Alpaca Market Data.
| Date | Open | High | Low | Close | What mattered |
|---|---|---|---|---|---|
| June 12 | $150.00 | $176.52 | $149.34 | $160.95 | IPO session |
| June 15 | $171.74 | $193.00 | $168.35 | $192.50 | First full follow-through day |
| June 16 | $200.51 | $225.64 | $195.13 | $201.80 | Options began trading |
| June 18 | $188.39 | $190.00 | $172.11 | $185.00 | Reversal accelerated |
| June 22 | $176.04 | $176.75 | $154.00 | $154.60 | 16.4% one-day close-to-close drop |
| June 23 | $151.06 | $165.50 | $147.11 | $156.11 | Post-IPO low so far |
| June 26 | $150.62 | $158.40 | $148.51 | $153.23 | Latest completed session |
From the June 16 option-session open to that morning's high, SPCX gained 12.5%. From the $225.64 high to the June 23 low, it fell 34.8%. The complete $78.53 range was 39.2% of the stock's price when options opened.
So the original call was not timid: SPCX really was violent. It was also a round trip rather than one clean directional trend, which matters enormously for a long straddle.
The Long Straddle Idea
A long straddle buys one at-the-money call and one at-the-money put with the same strike and expiration. The position is long gamma and long vega, but short theta. It can benefit from a large move in either direction or an increase in implied volatility. It loses when the stock sits still, time passes, or implied volatility contracts.
The quick premium hurdle is:
At expiration, the simplified breakevens are the strike plus or minus the total debit. The Options Industry Council's long-straddle guide covers the complete payoff and risk profile.
The original draft said I would only be interested "if IV was not super elevated." Now we can replace that vague phrase with actual numbers.
What the Opening SPCX Straddles Cost
I reviewed consolidated opening trades in the 200-strike contracts, using the stock's $201.30 first-minute volume-weighted price. I do not have archived opening bid/ask quotes, so the figures below use each leg's first-minute trade VWAP. They are an evidence-based pricing proxy, not a claim that both legs could have been filled simultaneously at those exact prices.
| Expiration | 200 call | 200 put | Combined premium | Premium as % of spot | Approx. implied volatility |
|---|---|---|---|---|---|
| June 18 | $17.69 | $12.76 | $30.45 | 15.1% | ~241% |
| July 17 | $31.49 | $27.93 | $59.42 | 29.5% | ~128% |
| August 21 | $43.28 | $37.00 | $80.28 | 39.9% | ~119% |
The IV estimates solve for one Black-Scholes volatility across both legs using a 4.56% risk-free rate and no dividend. Opening trades were moving rapidly and were not synchronized, so these should be read as approximate. They are still decisive: SPCX volatility was not cheap when the options opened.
The two-day straddle charged more than 15% of the stock price. The one-month straddle charged almost 30%. Market makers were demanding an extraordinary premium because everybody could see the same explosive setup.
Was It Actually a Killer Trade?
For a fast trader, potentially yes. For a passive buyer, no.
At 10:03 a.m. on June 16, SPCX printed its $225.64 session high. In that minute, the July 200 call and put traded at volume-weighted prices of approximately $46.88 and $21.67. The combined $68.55 was about 15.4% above the $59.42 opening proxy.
That is an excellent return for roughly half an hour, assuming a trader got filled near the opening proxy and could exit both legs near the later proxy. Those assumptions are doing real work in a brand-new, fast-moving chain.
Holding was a different story. Near SPCX's $147.11 low on June 23, the same July call and put traded around $2.66 and $54.43, or roughly $57.08 combined. Despite the stock moving more than $53 below the strike, the pair was about 4% below its opening proxy. The decline in IV and the passage of time consumed most of the directional gain.
The completed June 26 chain makes the result even clearer. Our Supabase snapshot marks those same July 200-strike contracts at $1.425 for the call and $48.50 for the put, or $49.93 combined. That is roughly 16% below the $59.42 opening proxy before accounting for execution.
The shortest expiration was harsher. The June 18 straddle cost about $30.45 at the opening proxy. SPCX closed expiration day at $185, leaving approximately $15 of intrinsic value at the 200 strike. A buy-and-hold position therefore lost roughly half its premium despite a spectacularly volatile stock.
That is the clean conclusion: the volatility forecast was right, but the market had already priced in a historic move. The profitable edge was in monetizing the path, not merely owning both options and waiting.
What the June 26 Chain Says Now
The SPCX backfill completed on June 27 using the June 26 closing snapshot. With the stock at $153.23, the current at-the-money straddles looked like this. Option prices are quoted per share; a standard two-leg position costs 100 times the combined mid.
| Expiration | ATM strike | Combined mid | Call / put IV | Implied move | Lower / upper breakeven | Net delta | Call / put OI |
|---|---|---|---|---|---|---|---|
| July 2 | $152.50 | $11.30 | 72.61% / 72.13% | 7.37% | $141.20 / $163.80 | +0.084 | 1,004 / 2,336 |
| July 17 | $152.50 | $20.60 | 70.69% / 70.72% | 13.44% | $131.90 / $173.10 | +0.102 | 497 / 1,181 |
| August 21 | $155.00 | $35.05 | 73.27% / 73.37% | 22.87% | $119.95 / $190.05 | +0.101 | 8,473 / 17,341 |
This confirms the missing piece from the opening-day analysis. The July 17 at-the-money IV fell from approximately 128% at launch to about 71% on June 26. The strikes differ because at-the-money moved from 200 to 152.50, but the comparison still shows the volatility regime for the same expiration compressing by roughly 57 volatility points.
Execution also improved in the shortest expiration. The July 2 call was quoted at $5.70 / $5.80 and the put at $5.50 / $5.60. The July 17 markets were wider at $10.10 / $10.70 and $9.90 / $10.50. Even after the opening frenzy ended, liquidity still varied materially by expiration.
What Delta Was Doing During the Move
A new long straddle is often described as delta neutral. That is a useful shortcut, not a law.
Using the same opening-price assumptions, the June 18 call had an estimated delta near +0.55 and the put near -0.45, for net delta around +0.10. The July call was near +0.59 and the put near -0.41, for net delta around +0.17. SPCX was already above the 200 strike, so both straddles began with a modest bullish tilt.
The June 26 data shows the full flip. At the original July 200 strike, the call delta had fallen to +0.111 while the put delta had grown to -0.906, leaving the old straddle near -0.795 net delta. A newly opened at-the-money July 152.50 straddle, by contrast, was back near +0.102 net delta.
Long gamma then changed that exposure quickly:
- As SPCX ran toward $225.64, the call delta moved closer to +1 while the put delta moved toward 0. The straddle became increasingly long stock as the rally continued.
- When SPCX reversed below 200, the put's negative delta became dominant and the call delta faded. The position flipped from net long to net short.
- That convexity rewards a sustained move, but an unhedged round trip gives back gains. A trader who actively delta-hedged could potentially harvest some of the realized movement, but that is a different, execution-intensive strategy.
This is why the delta path matters more than the slogan "straddles make money when stocks move." SPCX moved enough to create valuable gamma opportunities, but not in a way that guaranteed a profit for someone who bought once and waited.
What I Would Do Differently in Real Time
The checklist from the unpublished draft still holds up:
- Wait for quotes to stabilize. The first trades in a new chain are price discovery, not reliable fair value.
- Write down the dollar hurdle. A 29.5% one-month premium requirement is more informative than saying IV "looks high."
- Compare expirations. Two-day IV above 200% is a very different trade from one-month IV near 128%.
- Treat execution as part of the thesis. Two wide bid/ask spreads can erase a meaningful part of the expected edge.
- Plan the exit before entry. On June 16, the difference between monetizing the morning rally and holding through expiration was the difference between a strong gain and a large loss.
- Separate long gamma from buy-and-hold. A position can be an excellent vehicle for trading realized volatility and a poor passive investment at the same time.
The Option Screener long-straddle view makes these comparisons easier by putting expiration, premium, IV, volume, open interest, breakevens, and liquidity metrics in one table.
What About Open Interest and Dealer Exposure?
Opening-day volume showed what traded, but official open interest only became useful after positions cleared. The current snapshot now shows where meaningful positions remained: the August 155-strike straddle had 8,473 calls and 17,341 puts open, while the original July 200 strike had 18,196 calls and 6,751 puts open.
That distinction matters. Volume measures activity; open interest shows what remained outstanding.
We use the cleared chain to calculate gamma, vanna, charm, and net dealer exposure in VannaCharm. The SPCX option root also contains legacy pre-IPO contract records, so I am keeping aggregate dealer-exposure claims out of this post until those records are isolated from the SpaceX-era chain. A separate VannaCharm blog follow-up should use only the cleaned SpaceX-era contracts.
In Conclusion
I was right to expect violent price discovery in SPCX. The stock moved from a $225.64 high to a $147.11 low in five trading sessions, and the opening rally gave a well-timed long straddle a real opportunity to monetize gamma.
I was also right not to call the trade attractive before seeing the chain. Near-term implied volatility opened above 200%, and even the one-month 200-strike straddle cost almost 30% of the stock price. That premium turned a spectacular stock move into a timing-sensitive options trade.
The strongest takeaway is not "always buy straddles on exciting IPOs." It is this:
A correct volatility thesis is only half a trade. Price, delta, path, and exit discipline decide whether the thesis becomes a profit.
Best wishes,
Chris